The Challenge
My team and I acquired a data set with the task of running analysis on it, testing questions we decided on based on aspects of the set.
The Data Set
Consisting of over 300,000 data points, each a single occurrence within PokemonGO by a player, our data set involved information about where the occurrence took play, the time of day, which Pokemon occurred, the weather at the time, a categorization of the environment the occurrence took place in, and data about whether a co-occurrence took place.
resources: https://www.kaggle.com/semioniy/predictemall https://www.pokego.org/rare-pokemon-list/
The Visualizations
The visualizations chosen were meant to aid us as we conveyed our findings. In most of the cases, we adopted conventional visualizations (histograms, scatter plots, and heat maps. However, with our co-occurrence data we had two graphs expressing two main ideas of the data which became the basis for a custom visualization.

Introduction
Questions
"Does the distribution of Pokemon differ based on the setting or terrain of where they encountered?"
"Can one classify the rarity of the Pokemon based on environmental conditions (temperature, pressure, and wind speed)?"
"Which Pokemon co-occurr the most?"
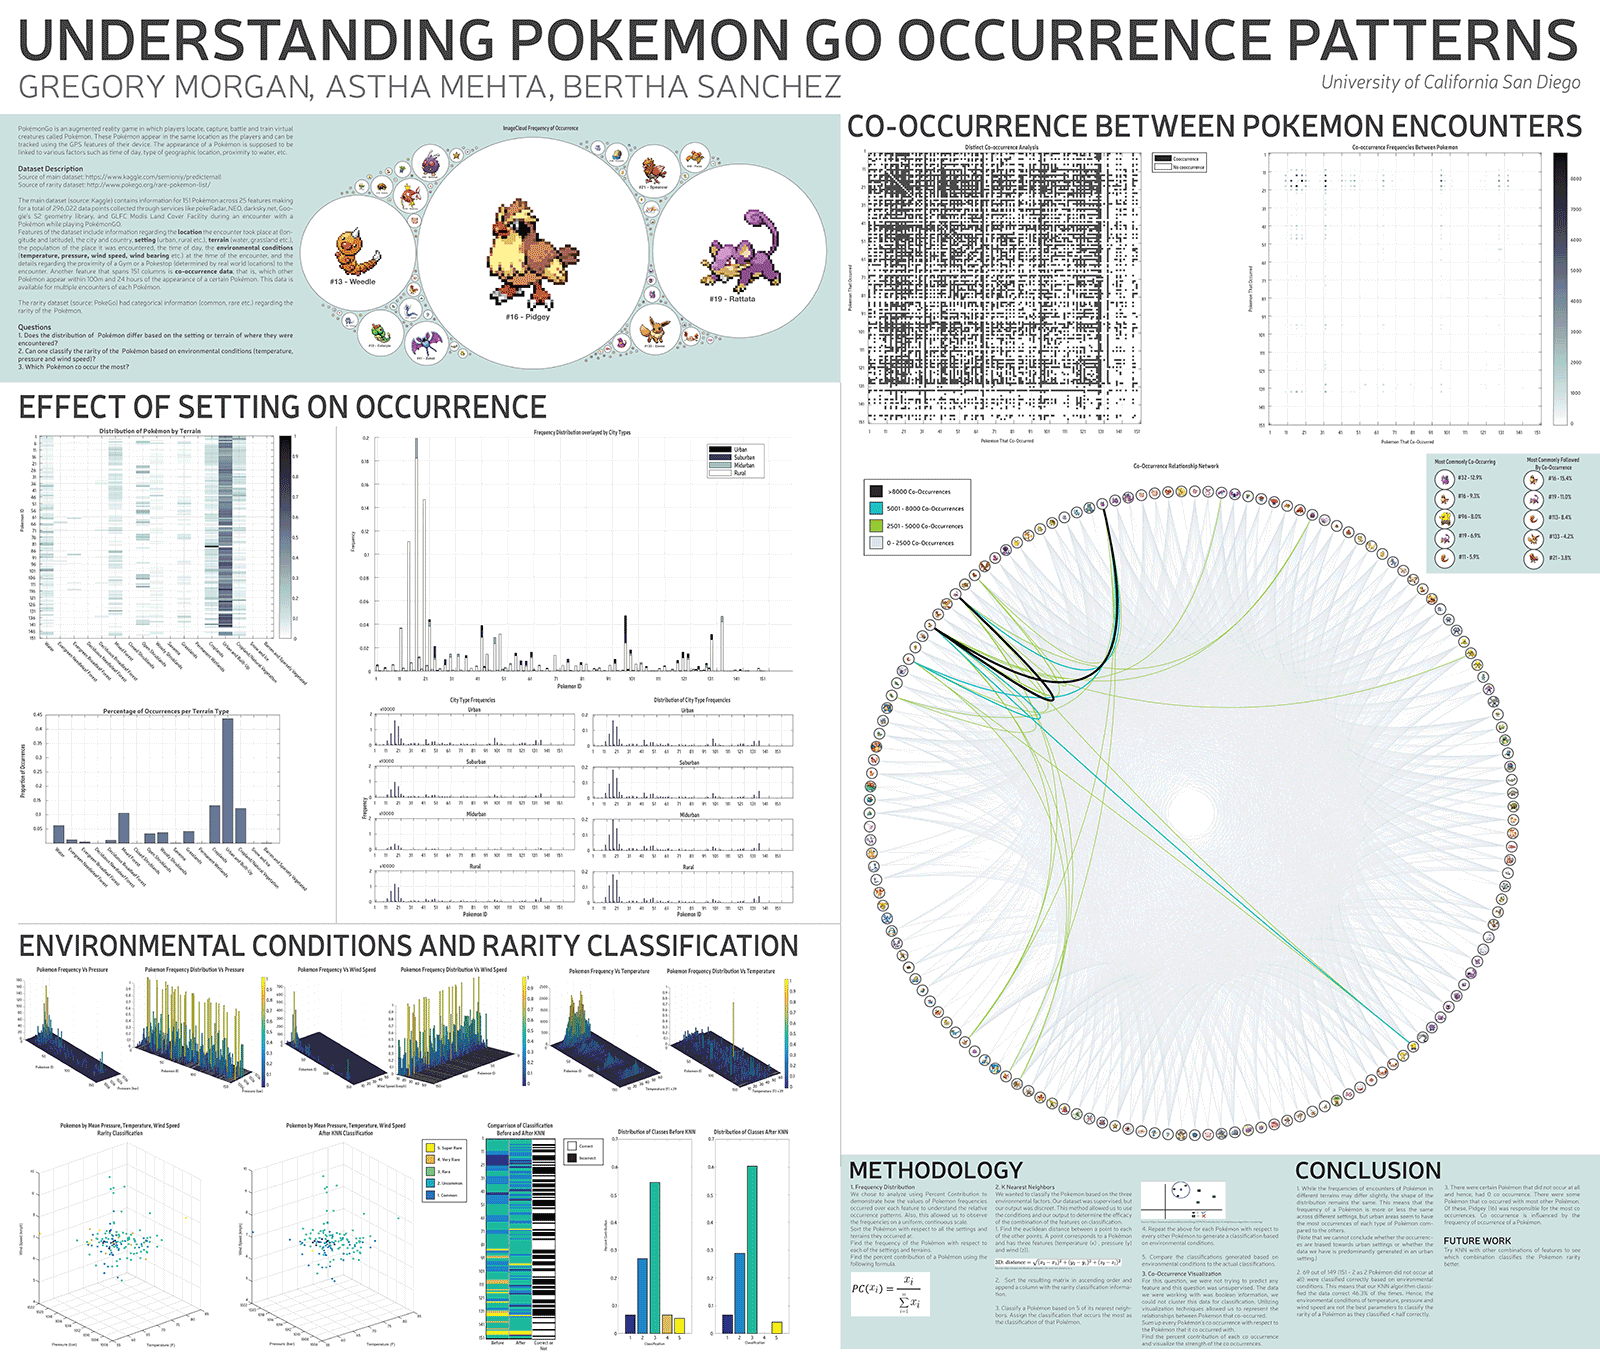
We aimed to gain an understanding of what the data consisted of. To do this, we counted the total occurrences of all the pokemon, getting the number of occurrences per pokemon in the set. As we were interested in predicting pokemon occurrences, we had to be able to determine if it was not just because a pokemon occurs frequently.
The first figure shows the results of counting every pokemon and then visualizing them in relation to one another. Pidgey, the most common pokemon in the data set appears in relation to the frequency of the other 150 in the set.

Setting Analysis
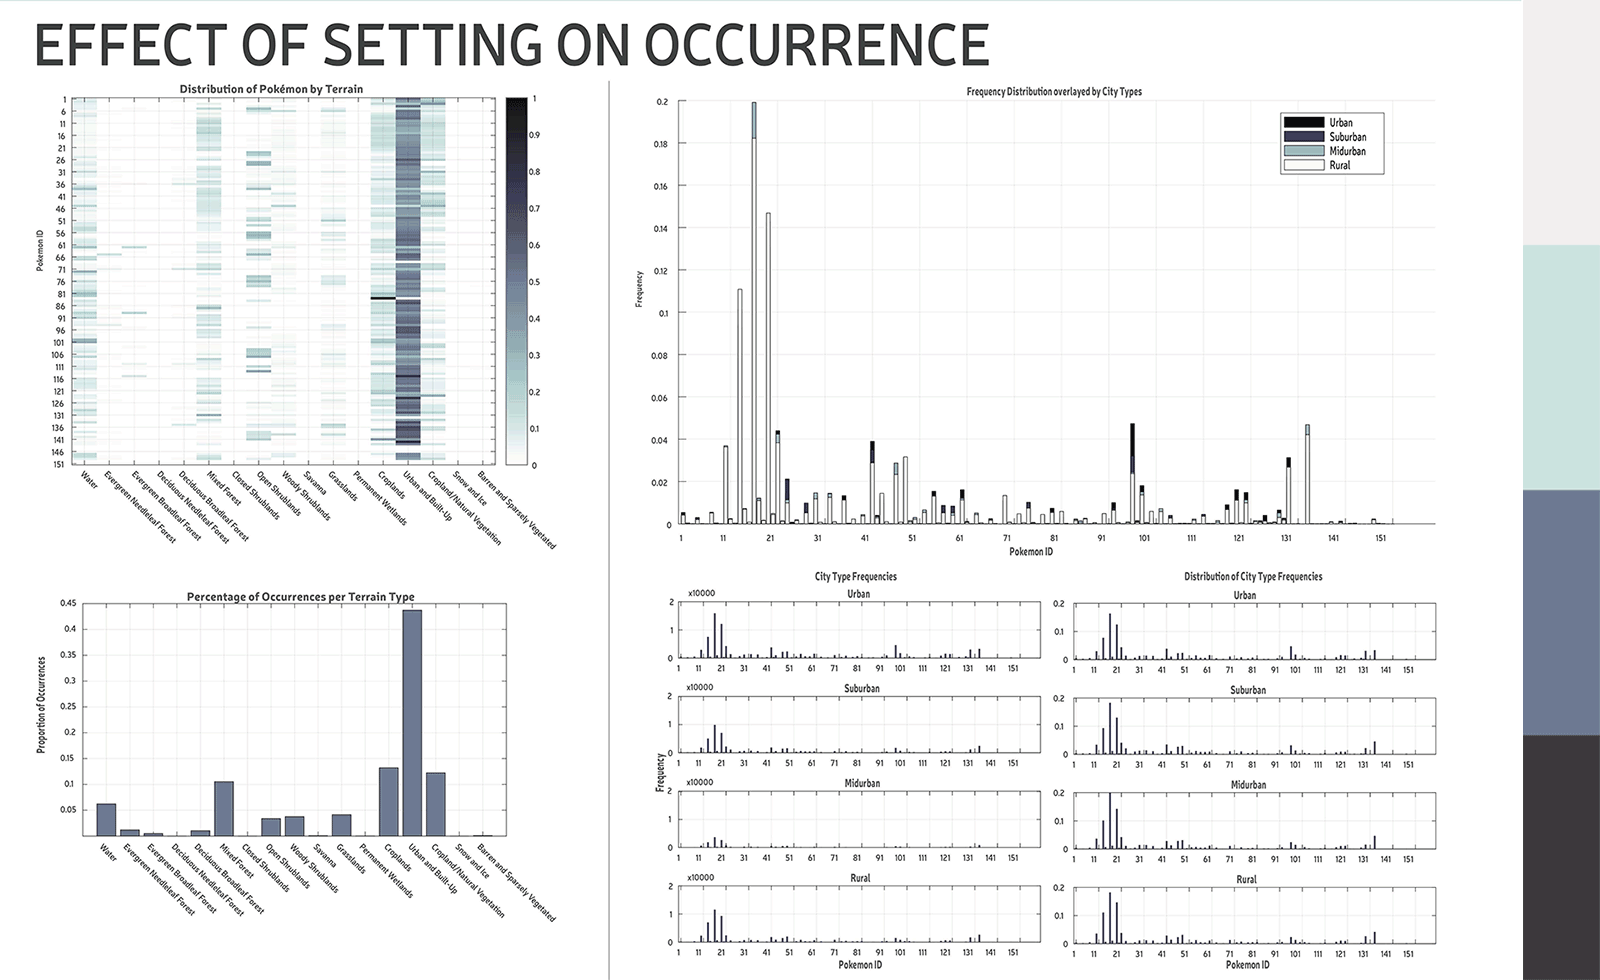
We aimed to determine whether the setting (difference between urban areas to forest and oceans, etc) would effect the occurrence patterns we see. To do so, we categorized the data between the setting features. We compared the totals from all of the categories to one another (left) while also normalizing the data to see the proportion of occurrences in comparison to each setting feature (right).

Environmental Analysis
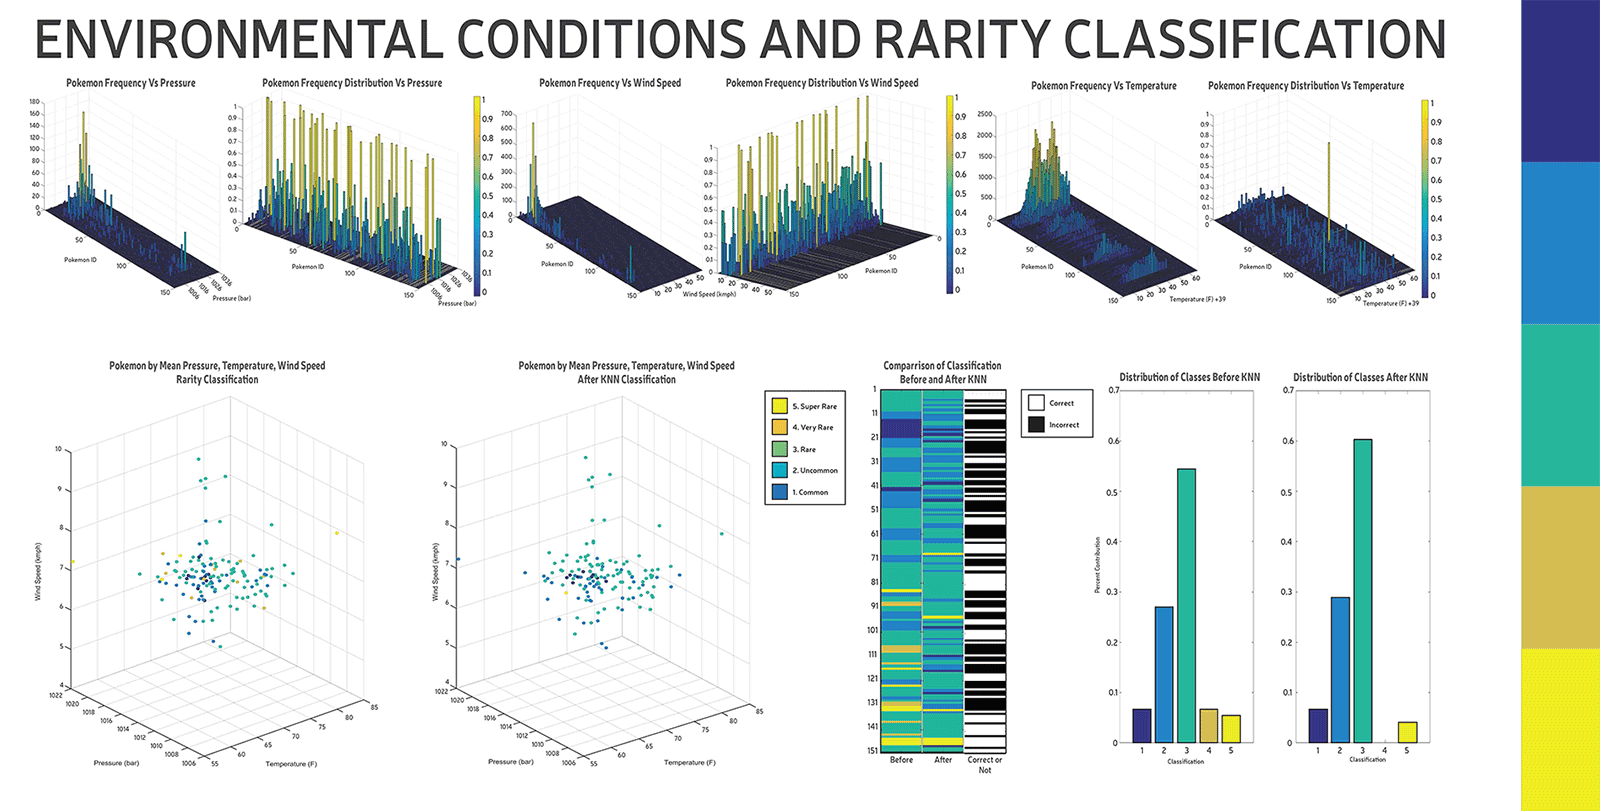
The set contained various features of environmental data at the time and place the occurrence happened at. We aimed to understand the effect this data could have by comparing the distribution frequencies against these factors.
In an additional attempt to understand it, we gathered data on the rarity as a categorization based on the developers. We then attempted to utilize the environmental data we had to recreate the rarity classification.

Co-occurrence Analysis
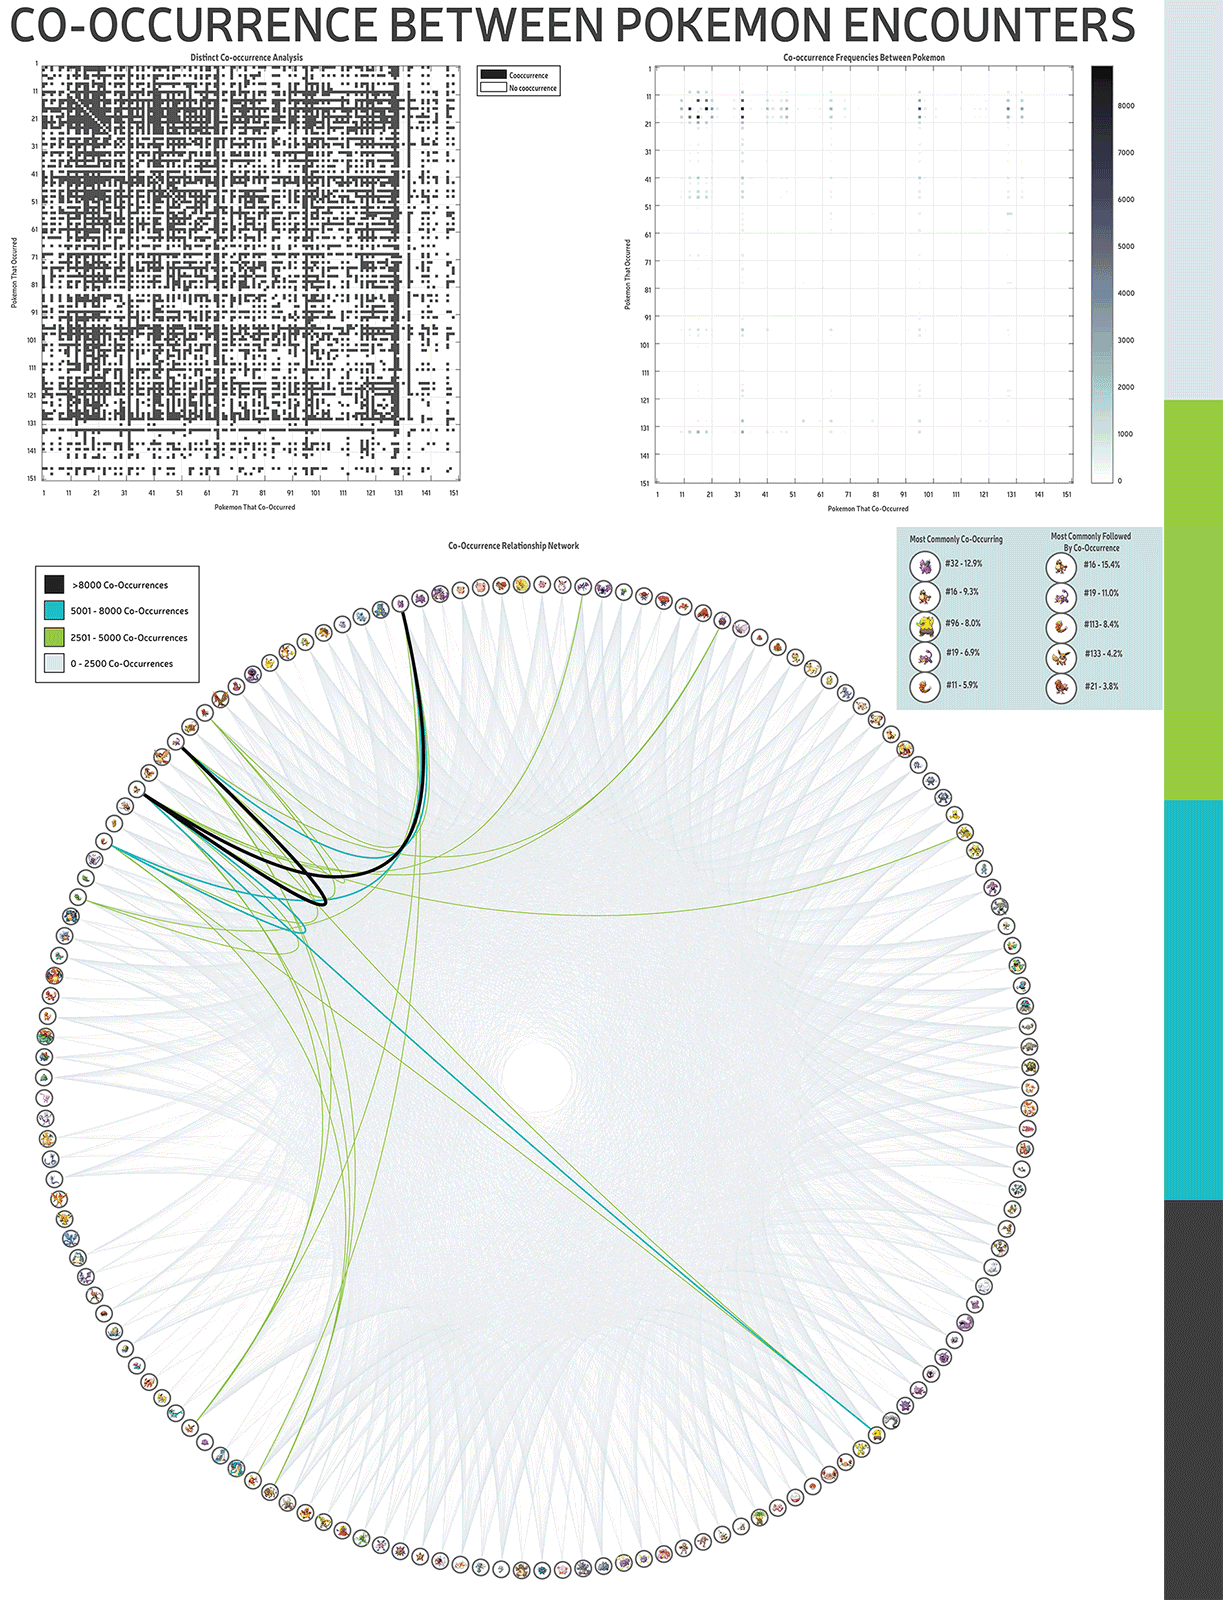
A co-occurrence is defined as two pokemongo occurrences taking place within 100m and within 24 hours of taking place. Each occurrence had boolean data of all the pokemon which co-occurred with it as part of features of the data point. We determined whether any two pokemon co-occurred with one another as boolean data within a matrix (left). To understand the frequency of each pair of co-occurrers, we compared the frequencies of each pair to the total number of co-occurrences (right).
With these two visualizations of the data, we wanted to develop a new visualization to understand this. Taking inspiration from neural network visualizations, we place each pokemon on the outside of a circle, for every co-occurrence there is an arch connecting the two pokemon. If a at least one co-occurrence takes place, then an arch exists (boolean data), however the arcs are then categorized based on how many take place (frequency data).

Conclusion
The long story short is that we did not find any strong enough evidence to accept our hypthesis that frequency can change based on setting or environment. The distributions we saw all reflected our initial summations of the data. Pokemon, regardless of setting or environment, just occur at certain frequencies giving a standardized distribution across all factors. With co-occurrece information, this seemed to remain true as the ones which had the highest number of co-occurrences were also the ones which just occurred the most.
